🌍
The Imperative: Diversifying Beyond the "Big Three"
More than 50% of the world’s plant-derived caloric intake relies on just three monoculture staple cereals: rice (Oryza sativa), wheat (Triticum aestivum), and maize (Zea mays). While modern genomic tools transformed these crops, hundreds of indigenous, underutilized "orphan" species—such as finger millet, pearl millet, grain amaranth, cowpea, pigeonpea, and chilli pepper—hold the evolutionary keys to extreme climate resilience, unyielding drought/salinity tolerance, and dense micronutrient bioavailability (zinc, iron, magnesium, calcium).
Historically, quantitative genetic dissection in minor crops was hindered by the lack of contiguous chromosome-scale reference assemblies and high-density genotyping arrays. Today, the convergence of PacBio HiFi / ONT long-read sequencing, cost-effective whole-genome resequencing (WGS), and robust multi-locus mixed linear models (MLM, FarmCPU, BLINK) empowers breeders to rapidly identify causal alleles in orphan crops without decadal crossing schemes.
⚠️ Core Methodological Principle:
A statistically significant Manhattan peak ($-\log_{10}(p) \ge 6.0$) indicates linkage disequilibrium with a genomic interval; it is not automatically a causal gene or validated breeding marker. Independent validation across diverse cohorts, multi-environment replication, and functional multi-omics integration (eQTL, mGWAS, CRISPR validation) are mandatory before deploying markers into marker-assisted selection (MAS).
Methodological Deep-Dive
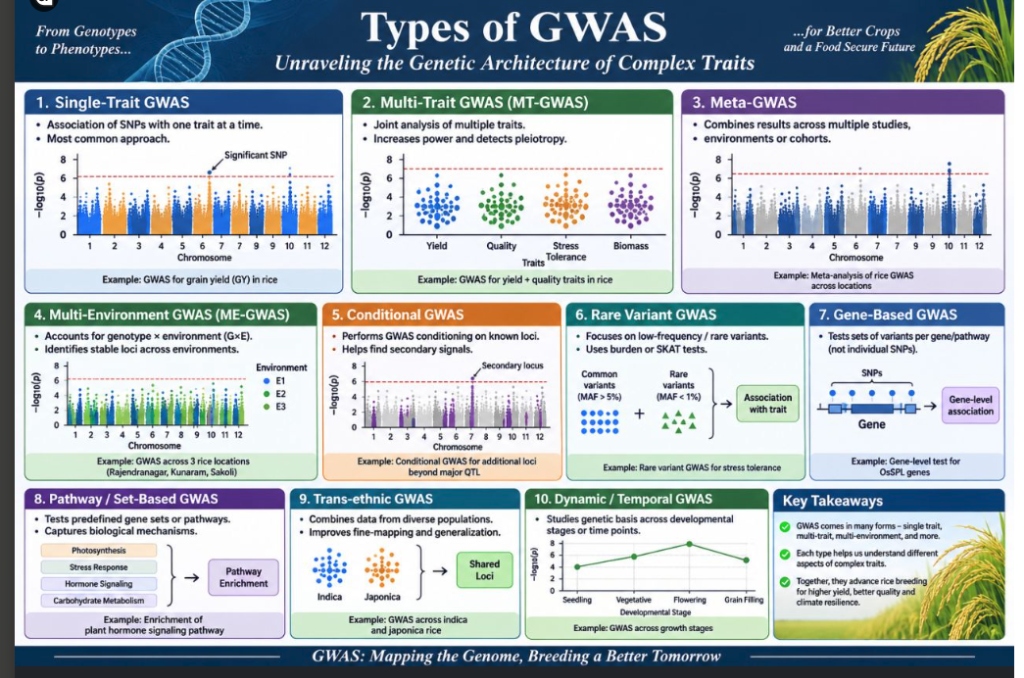
The 10 GWAS Paradigms: How Different Approaches Solve Crop Breeding Challenges
Different phenotypic architectures require tailored statistical models. Below is the complete framework covering mathematical formulation, minor crop applications, and peer-reviewed benchmark literature.
01
Single-Trait GWAS
Standard Baseline Scan
The foundational approach testing the linear association between individual single nucleotide polymorphisms (SNPs) and a single quantitative or binary trait (e.g., fruit weight, days to flowering, pericarp thickness). Controls for population stratification ($Q$) using principal components and cryptic relatedness ($K$) via kinship matrices in mixed linear models ($y = X\beta + Zu + e$).
Minor Crop & Vegetable Applications: Mapping fruit shape, fruit elongation index, capsaicinoid biosynthesis (pungency), and flowering time in landraces of Capsicum annuum, cowpea, and finger millet.
📚 Benchmark Study: Lee et al. (2020) • Investigated major fruit-related traits in Capsicum annuum (chilli pepper) identifying master regulatory loci for fruit shape and weight.
View Paper →
02
Multi-Trait GWAS (MT-GWAS)
Pleiotropy & Correlated Traits
Joint statistical analysis across multiple correlated phenotypes simultaneously (e.g., grain yield + protein content + plant height). MT-GWAS models cross-trait genetic and environmental covariance, drastically increasing statistical power to detect pleiotropic loci that remain sub-threshold in individual univariate scans.
Minor Crop & Vegetable Applications: Untangling negative trade-offs between grain yield and grain mineral density (Fe/Zn) in millets, or fruit firmness vs. soluble solids (sugar content) in Solanaceous vegetables.
📚 Benchmark Study: Jaiswal et al. (2016) • Dissected 14 agronomic traits in bread wheat comparing single-locus, multi-locus, and multi-trait association mapping for complex pleiotropic QTLs.
View Paper →
03
GWAS Meta-Analysis (Meta-GWAS)
Multi-Cohort Synthesis
Synthesizes summary statistics ($\beta$ effect sizes and standard errors) across independent study populations, breeding cohorts, or separate historical trials without requiring individual-level raw genotype pooling. Employs inverse-variance weighting (fixed vs. random effect meta-analysis) to uncover universal marker associations.
Minor Crop & Vegetable Applications: Overcoming small sample sizes ($N < 200$) in underfunded orphan crop programs by pooling summary statistics across national genebanks and regional research stations.
📚 Benchmark Study: De Walsche et al. (2025) • Introduced metaGE, an R package for GWAS meta-analysis across multiple environments and genotype-by-environment ($G \times E$) interaction modeling in plants.
View Paper →
04
Multi-Environment GWAS (ME-GWAS)
G × E Interaction Modeling
Evaluates the same germplasm panel across distinct geographic locations, planting seasons, or climatic stress gradients (e.g., well-watered vs. drought-stressed). Explicitly partitions main genetic effects ($G$) from genotype-by-environment interactions ($G \times E$), isolating both broadly stable alleles and environment-specific adaptation loci.
Minor Crop & Vegetable Applications: Grain amaranth and pearl millet multi-location trials evaluating stable micronutrient bioavailability (Fe, Zn, Ca, Mg) under extreme semi-arid climates.
📚 Benchmark Study: Prabhakaran et al. (2024/2026) • Investigated calcium, iron, magnesium, and zinc accumulation in grain amaranth (Amaranthus spp.) across multi-environment trials to uncover stable biofortification alleles.
View Paper →
05
Conditional GWAS
Dissecting Secondary Signals
Performs genome-wide association testing while including known lead causal SNPs as fixed covariates in the regression model. This "conditions out" the primary peak effect, revealing hidden secondary association signals, allelic heterogeneity, or masking epistatic interactions at the same locus.
Minor Crop & Vegetable Applications: Discovering secondary modifier alleles for pungency in chilli pepper beyond the dominant Pun1 locus, or plant architectural QTLs in brassica vegetables.
📚 Benchmark Study: Sasaki et al. (2022) • Demonstrated conditional GWAS to unravel secondary association peaks and epigenetic DNA methylation architectures controlling plant development in Arabidopsis.
View Paper →
06
Rare Variant GWAS (Burden & SKAT Tests)
MAF < 1% Association
Standard GWAS discards low-frequency variants (Minor Allele Frequency $\text{MAF} < 0.05$). Rare Variant GWAS aggregates sets of low-frequency variants ($\text{MAF} < 0.01$) across functional units using Burden tests (for uniform directional effects) or the Sequence Kernel Association Test (SKAT / SKAT-O) (for bidirectional or non-causal noise).
Minor Crop & Vegetable Applications: Capturing rare, lineage-specific stress resilience alleles (e.g., extreme heat shock factors, root rot resistance) preserved only in undomesticated crop wild relatives (CWRs) and remote landraces.
📚 Benchmark Toolchain: Lee et al. & SKAT Consortium • Optimal unified test (SKAT-O) combining burden and non-burden kernels for low-frequency variant mining in sequenced plant germplasm panels.
07
Gene-Based GWAS
Gene-Level Variant Aggregation
Evaluates the cumulative phenotypic effect of all polymorphisms (SNPs, short indels, missense variants) falling within a gene boundary (promoter + exons + UTRs) rather than testing isolated single SNPs. Dramatically reduces multiple-testing burden ($p$-value adjustment across $\sim 35,000$ genes rather than millions of SNPs) and directly nominates biological candidate genes.
Minor Crop & Vegetable Applications: Pinpointing transcription factor families (e.g., WRKY, NAC, bZIP) and transporters controlling salinity extrusion or drought avoidance in pulses and millets.
📚 Benchmark Study: Yano et al. (2016) • Used whole-genome resequencing and gene-based association analysis in rice to identify major agronomically relevant genes (e.g., OsSPL gene models) controlling grain morphology and yield.
View Paper →
08
Pathway & Set-Based GWAS
Biological Cascades
Tests whether predefined biological pathways (e.g., plant hormone signaling, betalain biosynthesis, flavonoid metabolism, photosynthesis antenna proteins) are collectively enriched with modest association signals that individually fail genome-wide significance.
Minor Crop & Vegetable Applications: Elucidating the metabolic cascades governing pigment accumulation (betacyanins) in grain amaranth and capsaicinoid synthesis pathways in peppers.
09
Trans-Population / Cross-Subspecies GWAS
Fine-Mapping Across Lineages
Leverages contrasting linkage disequilibrium (LD) decay profiles across diverse subspecies or genetic subpopulations (e.g., indica vs. japonica in rice, or grain vs. leaf amaranth species). Because causal variants retain identical associations while linked neutral SNPs break down across divergent genetic backgrounds, trans-population scans achieve single-gene resolution fine-mapping.
Minor Crop & Vegetable Applications: Cross-mapping between cultivated grain amaranths (A. hypochondriacus, A. cruentus, A. caudatus) and wild ancestors (A. hybridus) to break spurious LD blocks and isolate nutrient transport genes.
10
Dynamic & Temporal GWAS
Longitudinal Growth Trajectories
Replaces static single-endpoint measurements with high-resolution temporal phenotyping (e.g., UAV drone imaging of canopy height, NDVI vegetation indices, or biomass accumulation tracked weekly across: Seedling → Vegetative → Flowering → Grain Filling). Employs functional data analysis, spline regression, or random regression linear mixed models to identify stage-specific QTLs.
Minor Crop & Vegetable Applications: Capturing early seedling vigour and drought escape flowering transitions in millets that determine final yield under monsoon deficits.
PRODUCTION TOOLCHAINS
Multi-Locus GWAS in R with GAPIT 3 (FarmCPU & BLINK)
R 4.3+ • GAPIT v3.4
Standard single-locus Mixed Linear Models (MLM) can suffer from false negatives because the kinship matrix absorbs true causal genetic variation. FarmCPU and BLINK solve this by iteratively selecting pseudo quantitative trait nucleotides (QTNs) as fixed covariates while simultaneously adjusting for kinship:
# Install GAPIT 3 from source / GitHub
if (!require("devtools")) install.packages("devtools")
devtools::install_github("jiabowang/GAPIT3", force = TRUE)

library(GAPIT)

# Load Phenotypic Data (Accession ID + Multi-Environment Trait BLUPs)
pheno <- read.table("minor_crops_pheno_mineral_blups.txt", header = TRUE, sep = "\t")

# Load Genotype Data (HapMap or numerical matrix format)
# Formats supported: HapMap (.hmp.txt), VCF, PLINK bed/bim/fam
geno <- read.delim("millet_diversity_panel_filtered_maf005.hmp.txt", header = FALSE)

# Execute Multi-Locus Association Mapping (FarmCPU & BLINK)
myGAPIT <- GAPIT(
  Y = pheno[, c("Taxa", "Zinc_Content_mg_kg", "Iron_Content_mg_kg")],
  G = geno,
  PCA.total = 4,                   # Top 4 Principal Components for Q matrix
  model = c("FarmCPU", "BLINK"),   # Dual-algorithm execution
  kinship.algorithm = "VanRaden", # Modern genomic relationship matrix
  Multiple_analysis = TRUE,        # Joint execution across traits
  Major.allele.zero = TRUE,
  cutOff = 0.05,                   # Bonferroni/FDR significance threshold
  file.output = TRUE
)

# Automated Outputs Generated:
# 1. Manhattan Plots (Interactive HTML & Publication-Ready PDF)
# 2. QQ Plots (Quantile-Quantile diagnostic for inflation factor lambda)
# 3. Association summary tables with p-values, FDR q-values, and allelic effect sizes (beta)