omics.co.in logo omics.co.in
🕸️ TRACK 23 • 10 MODULAR CHAPTERS SYSTEMS BIOLOGY • CO-EXPRESSION ARCHITECTURE PLANT STRESS • TRANSCRIPTOMICS
Scale-Free Topology • Module Eigengenes • Trait Correlation • Hub Gene Mining

WGCNA: Weighted Gene Co-expression Network Analysis in R

From Raw Expression Counts to Scale-Free Network Construction, Topological Overlap (TOM), Trait-Correlated Eigengenes & Cytoscape Hub Extraction.

Move beyond simple pairwise differential expression into higher-order systems biology co-regulation architectures. Learn how to construct signed weighted co-expression networks from RNA-seq counts, evaluate scale-free topology criteria, identify co-regulated modules via dynamic tree cutting, correlate module eigengenes with multi-factorial physiological stress traits, prioritize intramodular master regulator hub genes (kME), and export publication-ready networks for Cytoscape.

📦 Production WGCNA & Bioconductor Stack in R CRAN + Bioconductor 3.19+
# Install Core Systems Biology & Co-expression Toolchain in R
if (!requireNamespace("BiocManager", quietly = TRUE)) install.packages("BiocManager")
BiocManager::install(c("WGCNA", "DESeq2", "AnnotationDbi", "clusterProfiler",
                       "CorLevelPlot", "impute", "preprocessCore", "tidyverse"))
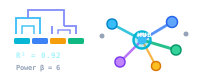
WGCNA Gene Network Graphic
Curriculum Specifications Track 23
Format & Duration
Self-Paced / Guided • 10 Modular Chapters
Core Toolchain
R 4.4+ • WGCNA • DESeq2 (VST) • Cytoscape
Case Study Targets
Plant Abiotic Stress (Drought, Salinity, Multi-Replicate)
Network Topology
Signed Scale-Free Adjacency (R² ≥ 0.85) • TOM
Visual & Functional Mining
Module Eigengene (ME) Trait Heatmaps • kME Hubs
Academic Access
100% Free & Open Access
View 10 Modules ↓
🕸️ View 10 Modules Curriculum ↗
👥

Who Should Attend

🌱
Plant & Agricultural Biologists Researchers dissecting drought, heat, salinity, and biotic stress transcriptomes in crop and model species.
💻
Bioinformaticians & Data Analysts Analysts transitioning from pairwise differential expression lists to systems-level modular networks.
🔬
Systems Geneticists & eQTL Researchers Scientists correlating module eigengenes with physiological traits and identifying driver hub genes.
🎓
Life Science PhD Scholars & Postdocs Acquiring publication-grade skills in R, WGCNA, scale-free network topology, and Cytoscape visualization.
🎯

Learning Outcomes

  • Compute homoscedastic variance-stabilized expression matrices with DESeq2 (vst(blind = FALSE)).
  • Fit signed scale-free network topology ($R^2 \ge 0.85$) and resolve ambiguous power choices mathematically.
  • Construct Topological Overlap Matrices (TOM) and identify co-expressed clusters with Dynamic Tree Cut.
  • Correlate module eigengenes with physiological traits using matrix-wide Benjamini-Hochberg FDR correction.
  • Screen and prioritize intramodular hub genes via module membership ($k_{ME}$) and gene significance ($GS$).
  • Export weighted subnetworks safely to Cytoscape and execute background-controlled Gene Ontology enrichment.
🔬 4-PHASE CURRICULUM ARCHITECTURE

Co-expression Network Analysis Roadmap & Benchmarks

Self-paced, hands-on masterclass curriculum structured into 4 foundational phases with production R scripts and benchmark plant abiotic stress transcriptomes.

PHASE 1

Foundations & Preprocessing

Modules 01–03 • Data Contracts & Homoscedasticity

  • Pairwise DEGs vs systems-level co-expression topology
  • Enforcing strict metadata-to-count data contracts
  • Low-count gene filtering across biological replicates
  • Variance-Stabilizing Transformation (VST) with blind=FALSE
  • Outlier detection with goodSamplesGenes & clustering
PHASE 2

Scale-Free Topology & Modules

Modules 04–05 • Adjacency, TOM & Dynamic Tree Cut

  • Mathematical derivation of soft vs hard thresholding
  • Signed network adjacency and pickSoftThreshold
  • Topological Overlap Matrix (TOM) calculation
  • Dynamic Tree Cut algorithm for hierarchical clustering
  • Merging correlated modules at mergeCutHeight = 0.25
PHASE 3

Traits & Hub Prioritization

Modules 06–07 • Eigengenes & Module Membership

  • Module Eigengene (ME) calculation and extraction
  • Pearson correlation against continuous & binary traits
  • Matrix-wide Benjamini-Hochberg FDR correction
  • Intramodular connectivity & module membership (kME)
  • Ranking driver hub genes and locus annotation
PHASE 4

Enrichment, Cytoscape & Validation

Modules 08–10 • clusterProfiler & Module Preservation

  • Gene Ontology & KEGG enrichment via clusterProfiler
  • Defensive gene universe definition (avoiding inflation)
  • Memory-conscious subnetwork export for Cytoscape
  • Network styling and visual layout customization
  • Cross-dataset module preservation statistics (Zsummary)
COURSE CURRICULUM

10 Comprehensive Modular Chapters

All modules include executable R code, defensive scripts, and test count matrices
MODULE 01 Phase 1: Foundations & Prep

Chapter 1: Conceptual Framework: Differential Expression vs. Co-expression Networks in Systems Biology

Pairwise differential expression versus systems-level co-expression topology; biological foundations of scale-free networks; module definitions, module eigengene summarization, and diagnosing the grey module without dogmatic percentage thresholds.

🎯 Key Deliverables:
  • Input count contract verification & defensive assertion pipeline
  • Homoscedastic VST matrix & sample outlier dendrogram
DESeq2 VST AnnotationDbi goodSamplesGenes RStudio
Explore Chapter 01 →
MODULE 02 Phase 1: Foundations & Prep

Chapter 2: Bioconductor Stack Setup, Environment Isolation & Input Data Contracts

Installing WGCNA, DESeq2, AnnotationDbi, and plant annotation packages (org.At.tair.db); enforcing strict data contracts between raw integer count matrices and multi-factor experimental metadata; defensive assertions in R.

🎯 Key Deliverables:
  • Input count contract verification & defensive assertion pipeline
  • Homoscedastic VST matrix & sample outlier dendrogram
DESeq2 VST AnnotationDbi goodSamplesGenes RStudio
Explore Chapter 02 →
MODULE 03 Phase 1: Foundations & Prep

Chapter 3: Count Filtering, Variance-Stabilizing Transformation (VST) & Sample Outlier QC

Biological count filtering across sample replicates, applying DESeq2 variance-stabilizing transformation (vst) with blind=FALSE, transposing to sample-by-gene format, and running goodSamplesGenes with hierarchical outlier clustering.

🎯 Key Deliverables:
  • Input count contract verification & defensive assertion pipeline
  • Homoscedastic VST matrix & sample outlier dendrogram
DESeq2 VST AnnotationDbi goodSamplesGenes RStudio
Explore Chapter 03 →
MODULE 04 Phase 2: Topology & TOM

Chapter 4: Soft-Threshold Selection & Scale-Free Topology Fitting

Mathematical derivation of soft vs hard thresholding; evaluating signed network adjacencies; executing pickSoftThreshold; plotting scale-free fit vs mean connectivity; diagnostic flowchart for handling NA power estimates with scientific justification.

🎯 Key Deliverables:
  • Scale-free fit R² ≥ 0.85 evaluation & power selection diagnostics
  • Signed TOM blockwise modules & dynamic tree dendrogram
pickSoftThreshold Signed TOM DynamicTreeCut WGCNA
Explore Chapter 04 →
MODULE 05 Phase 2: Topology & TOM

Chapter 5: Network Construction, Topological Overlap Matrix (TOM) & Dynamic Module Detection

Constructing co-expression networks with blockwiseModules; calculating signed Topological Overlap Matrices (TOM); dynamic tree cutting; multi-block handling; converting numeric labels to colors; and merging similar modules at mergeCutHeight = 0.25.

🎯 Key Deliverables:
  • Scale-free fit R² ≥ 0.85 evaluation & power selection diagnostics
  • Signed TOM blockwise modules & dynamic tree dendrogram
pickSoftThreshold Signed TOM DynamicTreeCut WGCNA
Explore Chapter 05 →
MODULE 06 Phase 3: Traits & Hubs

Chapter 6: Module–Trait Associations, Matrix-Wide BH FDR Correction & Linear Modeling

Calculating Module Eigengenes (MEs); computing Pearson correlations against continuous and binary physiological stress traits; applying Benjamini-Hochberg FDR correction across the entire test matrix; and fitting linear models (lm(ME ~ treatment * timepoint)).

🎯 Key Deliverables:
  • Module–trait correlation matrix with matrix-wide BH FDR p-values
  • Ranked intramodular hub gene catalogue (kME & Gene Significance)
Module Eigengenes Pearson Cor Matrix BH FDR kME Rank
Explore Chapter 06 →
MODULE 07 Phase 3: Traits & Hubs

Chapter 7: Intramodular Hub Gene Prioritization & Module Membership (kME) Analysis

Quantifying module membership (kME) as correlation between gene expression and module eigengenes; calculating Student t-test p-values and BH-adjusted q-values; ranking central hubs; and annotating with Arabidopsis TAIR locus descriptions.

🎯 Key Deliverables:
  • Module–trait correlation matrix with matrix-wide BH FDR p-values
  • Ranked intramodular hub gene catalogue (kME & Gene Significance)
Module Eigengenes Pearson Cor Matrix BH FDR kME Rank
Explore Chapter 07 →
MODULE 08 Phase 4: Visuals & Validation

Chapter 8: Functional Enrichment with clusterProfiler & Statistical Background Definition

Performing Gene Ontology (GO) Biological Process and KEGG over-representation analysis; avoiding false positive inflation by properly defining the gene universe as non-grey, mapped network genes; semantic reduction with simplify; generating publication dotplots.

🎯 Key Deliverables:
  • Gene Ontology enrichment dotplots with strict background control
  • Cytoscape network edge/node exports & module preservation stats
clusterProfiler Cytoscape exportNetwork modulePreservation
Explore Chapter 08 →
MODULE 09 Phase 4: Visuals & Validation

Chapter 9: Memory-Conscious Cytoscape Export & Interactive Network Visualization

Memory calculations for dense Topological Overlap Matrices (N^2 * 8 bytes); safe intramodular subnetwork extraction; subsetting to top hub genes (MAX_NODES = 300); exporting weighted edge and node files with exportNetworkToCytoscape; Cytoscape styling guide.

🎯 Key Deliverables:
  • Gene Ontology enrichment dotplots with strict background control
  • Cytoscape network edge/node exports & module preservation stats
clusterProfiler Cytoscape exportNetwork modulePreservation
Explore Chapter 09 →
MODULE 10 Phase 4: Visuals & Validation

Chapter 10: Network Validation, Module Preservation, Troubleshooting & Experimental Follow-up

Validating co-expression modules across independent datasets with modulePreservation; troubleshooting common WGCNA pitfalls (batch effects, soft power anomalies, large grey modules); designing follow-up experimental perturbations (CRISPR/T-DNA mutants); Quarto workflow.

🎯 Key Deliverables:
  • Gene Ontology enrichment dotplots with strict background control
  • Cytoscape network edge/node exports & module preservation stats
clusterProfiler Cytoscape exportNetwork modulePreservation
Explore Chapter 10 →
Peer-Reviewed Foundations

📚 Foundational Literature & Methodology Benchmarks

Primary co-expression theory, biostatistics & functional mining citations for Track 23

🕸️ Network Theory, Scale-Free Topology & WGCNA

  • Langfelder P, Horvath S. (2008). WGCNA: an R package for weighted correlation network analysis. BMC Bioinformatics 9:559. doi:10.1186/1471-2105-9-559
  • Zhang B, Horvath S. (2005). A general framework for weighted gene co-expression network analysis. Statistical Applications in Genetics and Molecular Biology 4:Article 17. doi:10.2202/1544-6115.1128
  • Langfelder P, Mischel PS, Horvath S. (2007). When is hub gene selection better than standard differential expression? PLoS ONE 2(10):e1049. doi:10.1371/journal.pone.0001049
  • Dr. Faisal Qaseem. (2026). From RNA-seq to Gene Networks: A Practical WGCNA Tutorial for Plant Stress Biology. NextGen Coder. Tutorial Reference

📊 Biostatistics, Enrichment & Visualization

  • Love MI, Huber W, Anders S. (2014). Moderated estimation of fold change and dispersion for RNA-seq data with DESeq2. Genome Biology 15:550. doi:10.1186/s13059-014-0550-8
  • Wu T, Hu E, Xu S, et al. (2021). clusterProfiler 4.0: A versatile toolkit for translating omics data to biological knowledge. The Innovation 2(3):100141. doi:10.1016/j.xinn.2021.100141
  • Shannon P, Markiel A, Ozier O, et al. (2003). Cytoscape: a software environment for integrated models of biomolecular interaction networks. Genome Research 13(11):2498–2504. doi:10.1101/gr.1239303
  • Benjamini Y, Hochberg Y. (1995). Controlling the false discovery rate: a practical and powerful approach to multiple testing. Journal of the Royal Statistical Society B 57(1):289–300. doi:10.1111/j.2517-6161.1995.tb02031.x

Looking for Other Bioinformatics Specializations?

Explore all 20 Flagship Curricula across Systems Biology, Transcriptomics, Proteomics, GWAS, and Nextflow Pipelines.

Browse All 20 Curricula (252 Chapters) → Track 20: Plant RNA-Seq in R → Track 21: Spatial Transcriptomics →