
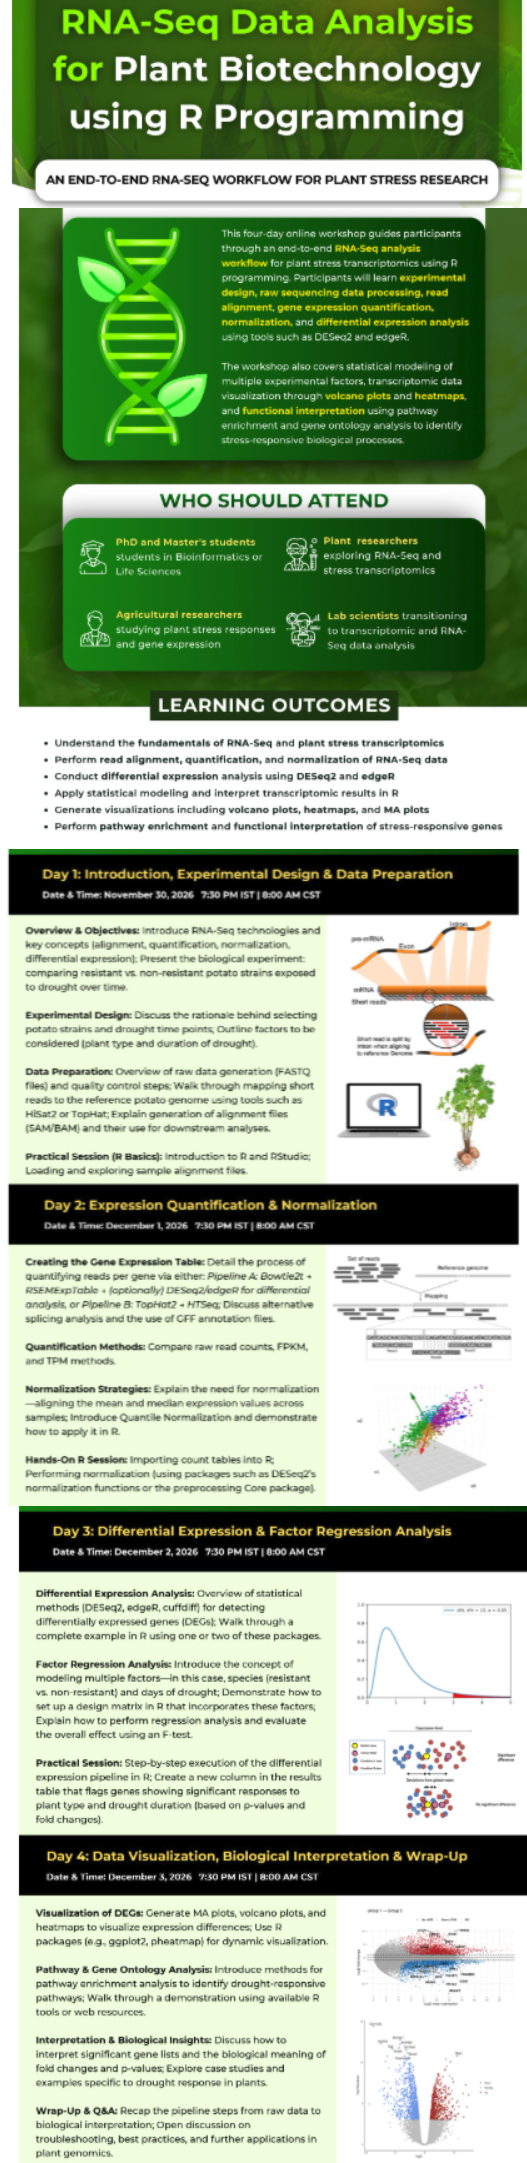
Who Should Attend
Learning Outcomes
- Understand the core fundamentals of RNA-Seq and plant stress transcriptomics.
- Perform read alignment, quantification, and normalization of plant RNA-Seq data.
- Conduct differential expression analysis using production packages DESeq2 and edgeR.
- Apply statistical modeling of multiple experimental factors (Genotype × Treatment) in R.
- Generate publication-quality visualizations including volcano plots, heatmaps, and MA plots.
- Perform pathway enrichment and functional interpretation of stress-responsive genes via clusterProfiler.
Daily Workshop Agenda & Practical Benchmarks
Live sessions held at 7:30 PM IST | 8:00 AM CST with full hands-on R scripts and real potato drought datasets.
Experimental Design & Data Prep
November 30, 2026 • 7:30 PM IST / 8:00 AM CST
- RNA-Seq concepts & potato drought experiment
- Selecting resistant vs non-resistant strains
- Raw FASTQ QC with FastQC & fastp
- Reference mapping with HISAT2 & TopHat2
- Hands-on R & RStudio alignment exploration
Quantification & Normalization
December 1, 2026 • 7:30 PM IST / 8:00 AM CST
- Pipeline A: Bowtie2 + RSEMExpTable
- Pipeline B: TopHat2 / HISAT2 + HTSeq
- Raw counts vs FPKM vs TPM
- Addressing RuBisCO compositional distortion
- DESeq2 Size Factors & Quantile Normalization
Differential Expression & Regression
December 2, 2026 • 7:30 PM IST / 8:00 AM CST
- DESeq2, edgeR, and cuffdiff methods
- Factor regression: Genotype × Drought Duration
- Design matrix construction & F-test / LRT
- Execution of complete DEG pipeline in R
- Automated significance flagging table
Visuals, Pathways & Wrap-Up
December 3, 2026 • 7:30 PM IST / 8:00 AM CST
- MA plots, Volcano plots, Heatmaps (pheatmap)
- Pathway & Gene Ontology analysis (clusterProfiler)
- Biological insights: ABA signaling, LEA, Osmolytes
- Troubleshooting plant extraction artifacts
- End-to-end reproducible script integration
10 Comprehensive Modular Chapters
Plant Stress Transcriptomics & Experimental Design in Solanum tuberosum
Principles of plant RNA-Seq, selecting potato cultivars (drought-tolerant vs susceptible), temporal sampling under water-deficit regimes, eliminating batch effects, and defining biological replication.
- Understanding plant transcriptional dynamics under abiotic stress
- Design matrix formulation: Genotype (tolerant vs susceptible) × Drought Timepoints
Plant Genome Resources, Spud DB, GFF3/GTF Annotations & FASTQ QC
Navigating plant reference genomes (Spud DB, Phytozome, Ensembl Plants), polyploidy considerations, filtering plastid/mitochondrial rRNA contamination, and running FastQC + fastp.
- Downloading Solanum tuberosum reference genomes (DM1-3 v4.04/v6.1) and GFF3/GTF annotations
- Dissecting plant gene models: CDS, UTR, pseudogenes, transposable elements, and chloroplast/mitochondria
Spliced Read Alignment to Complex Plant Genomes with HISAT2 & TopHat2
Building plant genome indexes, handling non-canonical plant introns and alternative splicing, executing HISAT2/TopHat2 alignments, and generating sorted, indexed BAM files with Samtools.
- Extracting splice sites and exons from plant GTF/GFF3 for index building
- Running HISAT2 with plant-specific parameters (--dta, --pen-noncansplice)
Gene & Isoform Quantification: featureCounts, HTSeq & RSEM
Quantifying exon and gene-level reads using featureCounts and HTSeq; executing Bowtie2 + RSEM for transcript isoform estimation; comparing raw integer counts, FPKM, and TPM.
- Running Subread featureCounts for paired-end plant RNA-Seq datasets
- HTSeq-count configuration: union, intersection-strict, and strand-specific handling
Normalization Strategies: TMM, DESeq2 Size Factors & Quantile Normalization
Overcoming compositional bias from high-abundance transcripts (e.g., RuBisCO / stress proteins); executing edgeR TMM, DESeq2 Median-of-Ratios, and preprocessCore Quantile Normalization.
- Understanding compositional distortion caused by massive RuBisCO (rbcS/rbcL) transcripts
- DESeq2 Median-of-Ratios size factor calculation and mathematical derivation
Differential Expression Modeling with DESeq2 and edgeR
Formulating the Negative Binomial model (Y_ij ~ NB(mu_ij, alpha_i)), empirical Bayes dispersion shrinkage, Wald tests, and log2 fold-change shrinkage using apeglm and ashr.
- Theoretical breakdown of the Negative Binomial distribution vs Poisson for RNA-Seq count overdispersion
- Empirical Bayes dispersion estimation and variance stabilization (vst & rlog)
Multi-Factor Experimental Modeling: Genotype × Drought Time-Series
Designing complex model matrices in R (~ genotype + time + genotype:time), conducting ANOVA-like Likelihood Ratio Tests (LRT) to uncover cultivar-specific stress adaptation genes.
- Setting up factorial design matrices in R: model.matrix(~ Genotype * Time)
- Distinguishing main effect genes (general drought response) from interaction genes (cultivar-specific tolerance)
Publication-Ready DEG Visualizations: Volcano Plots, MA Plots & Heatmaps
Generating customized MA plots, publication-grade Volcano plots with ggplot2 and EnhancedVolcano, and bidirectional hierarchically clustered heatmaps using pheatmap and ComplexHeatmap.
- Constructing MA plots displaying mean expression vs log2FC with shrunken estimates
- Creating publication-grade Volcano plots highlighting key drought transcription factors (DREB, WRKY, NAC)
Functional Enrichment: Plant GO, KEGG & Drought Biological Mechanisms
Gene Ontology and KEGG pathway enrichment using clusterProfiler; biological interpretation of ABA signaling, DREB/WRKY transcription factors, LEA proteins, and proline osmoprotection.
- Custom OrgDb preparation and GO enrichment (BP, MF, CC) using clusterProfiler
- Plant KEGG pathway enrichment: Plant hormone signal transduction, Starch/Sucrose metabolism, and Glutathione
Applied Capstone: End-to-End Plant Stress Pipeline & Quarto Reporting
Complete, reproducible R Markdown / Quarto pipeline script from raw count matrix to biological publication figures, gene tables, and cross-species validation in crop biotechnology.
- End-to-end reproducible R script executing complete multi-factor Solanum tuberosum workflow
- Automated generation of publication tables (.xlsx / .csv) with annotated DEGs and functional terms
Looking for Other Bioinformatics Specializations?
Explore all 20 Flagship Curricula across Genomics, Transcriptomics, Proteomics, GWAS, Single-Cell, and Nextflow Pipelines.